Dose response methodologies
Dose-response modelling is a key step in the RA workflow, and its main aim is to characterize the relationship between the exposures and the observed adverse outcome and eventually estimate human health guidance values, such as the Derived No effect Level (DNEL) values, which are eventually compared with exposure levels in order to estimate the risk.
In order to understand and model this relationship concerning toxic NMs as well as environmental factors, toxicology studies that involve multiple species, including humans and animals, are designed to investigate multiple exposure routes and media. Usually multiple dose-response curves are fitted, using in vitro and in vivo models, focusing on the dose response of the most sensitive organ, i.e. the target organ, of the species of interest for the exposure to the NM of interest. This gives information about the relationship between the actual dose that is delivered to the target tissue(s) and the biological effect(s) it causes deviating from the normal functions of the organism. There are two main approaches for conducting dose-response studies:
No Observed Adverse Effect Level (NOAEL) is defined as the highest experimental dose that does not produce a statistically or biologically significant increase in adverse effects over those of controls. An “acceptably safe” daily dose for humans is then derived by dividing the NOAEL by a safety factor, usually 10 to 1,000, to account for sensitive subgroups of the population, data insufficiency, and extrapolation from animals to humans (see, for example, [19]).
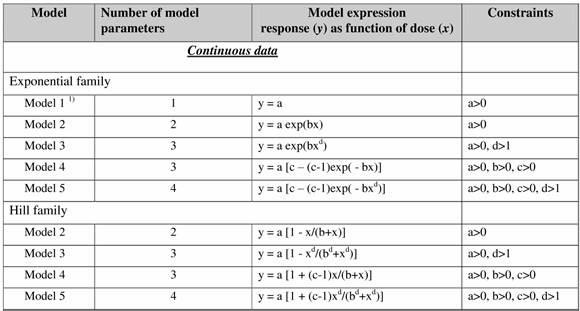
The Benchmark Dose (BMD) approach (Hardy et al., 2017) is based on exposing a predefined number of animals to different drug concentrations (including 0 for the so-called control unit) of the substance of interest in a predefined matrix (e.g. in air or water) and τηε selected indicators of effect are collected (e.g. number of deaths or weight of kidney). The resulting experimental dose-response results are fitted by two families of nested models of increased complexity, namely the exponential and the Hill families (Table 1). and the most “optimal” (parsimonious) model has been selected. The selected model indicated the BMD, which is actually a concentration where a predefined value relative to the control group level of response is reached, which defines the start of an effect (e.g. 5% of death rate or 20% kidney weight increase).

Table 1. Continuous response models for the Exponential family and Hill family models in the BMD approach.
Software implementations of the BMD approach
The BMD approach has been implemented in two software packages, namely the Benchmark Dose Software (BMDS) developed by EPA in the US and the PROAST software developed by RIVM. RIVM and EPA aim to achieve consistency between the BMDS and PROAST software, but there are still some differences, including a number of default settings for statistical assumptions. Furthermore, the two software packages differ in functionalities [24]. Examples of useful functionalities in PROAST are the possibility of statistically comparing dose-responses among subgroups (covariate analysis), and the larger flexibility in plotting. Currently, two web applications of PROAST are available, which do not include all functionalities of the R package, but only the usual dose-response analysis of toxicity data can be done. These web tools are provided by EFSA and the RIVM team (https://efsa.openanalytics.eu/ , https://proastweb.rivm.nl/ ). NTUA has integrated the PROAST software for continuous dose-response into the NanoCommons infrastructure through the Jaqpot computational platform and in particular through the IntPROAST R package web implementation of the software.
Work has also started on developing services for creating and hosting Bayesian causal models, which is an alternative approach to construct RA frameworks combining into the same network exposure and hazard information and RA.
References
- Hardy et al., 2017: Hardy, A.; Benford, D.; Halldorsson, T.; Jeger, M.J.; Knutsen, K.H.; More, S.; Mortensen, A.; Naegeli, H.; Noteborn, H.; Ockleford, C.; Ricci, A. Update: use of the benchmark dose approach in risk assessment. EFSA Journal 2017, 15(1). https://doi.org/10.2903/j.efsa.2017.4658