NanoCommons Demonstration Case - Best-practice in nanosafety study design and its documentation via visual experimental maps
This NanoCommons demonstration case is intended to define a way to document the study design in laboratories with respect to the decision making processes applied and how this can guide data management. This case is ongoing.
Table of contents
Background
Laboratories have a lot of inherent knowledge on how to design and implement a study, which is transferred from one generation of coworkers to the next or from the principal investigators to their coworkers. However, since this knowledge is often not documented on paper or electronically, it cannot be used outside the one laboratory to train researchers as early as at the undergraduate level. Nor can these in-house practices be evaluated to check if the process complies to state-of-the-art quality criteria and check how it compares to processes established in other laboratories. Therefore, this demonstration case is intended to define a way to document the study design process in specific laboratories with respect to the decision making process applied. Additionally, it will design approaches to use the study design as the basis for organising the data collection and management processes and the integration of quality assurance and control measures and their documentation.
Based on the very positive experience from the NIKC and NanoFASE projects with structuring experimental data collection around a graphical representation of the experimental steps (the study design) and the “NM instances”, where their characteristics may change, we propose to document our in-house and published (e.g., OECD test guidelines) best-practice experimental studies systematically utilising these graphical representations. The intention is that by having these visual representations of all data and metadata that should be included will provide a clear and consistent basis against which to quickly compare published studies in order to evaluate their compliance with optimal study design and/or their “completeness” in terms of full data and metadata collection, via the instance map concept. Visualisation of the experimental design, in term of the NMs, their environment, and the end-points to be captured and assays involved, has been shown to be a user-friendly way to encode the complexity of the experiments and, thus, of the complete dataset to be captured, including the relationship of metadata and data points, and allowing early identification of any additional data / metadata needed. An example of such an experimental workflow visualisation was used already in Demonstration Case Electronic Laboratory Notebooks for data collection and annotation (reproduced in Figure 1), as an instance map, where each blue diamond or hexagon is an “instance” of a NM in which its surroundings or form may change and thus for which additional description and /or characterisation information is needed. Many details can be added to these maps like required media and other chemicals, protocols including calibration steps and other quality assurance aspects associated with them. In this way, the study design documentation will already include information on the required QA/QC standards for the application of the data at hand e.g., by requesting pH and dissolved oxygen measurements at the end of a daphnia exposure to confirm compliance with the relevant OECD test guidelines for regulatory testing.
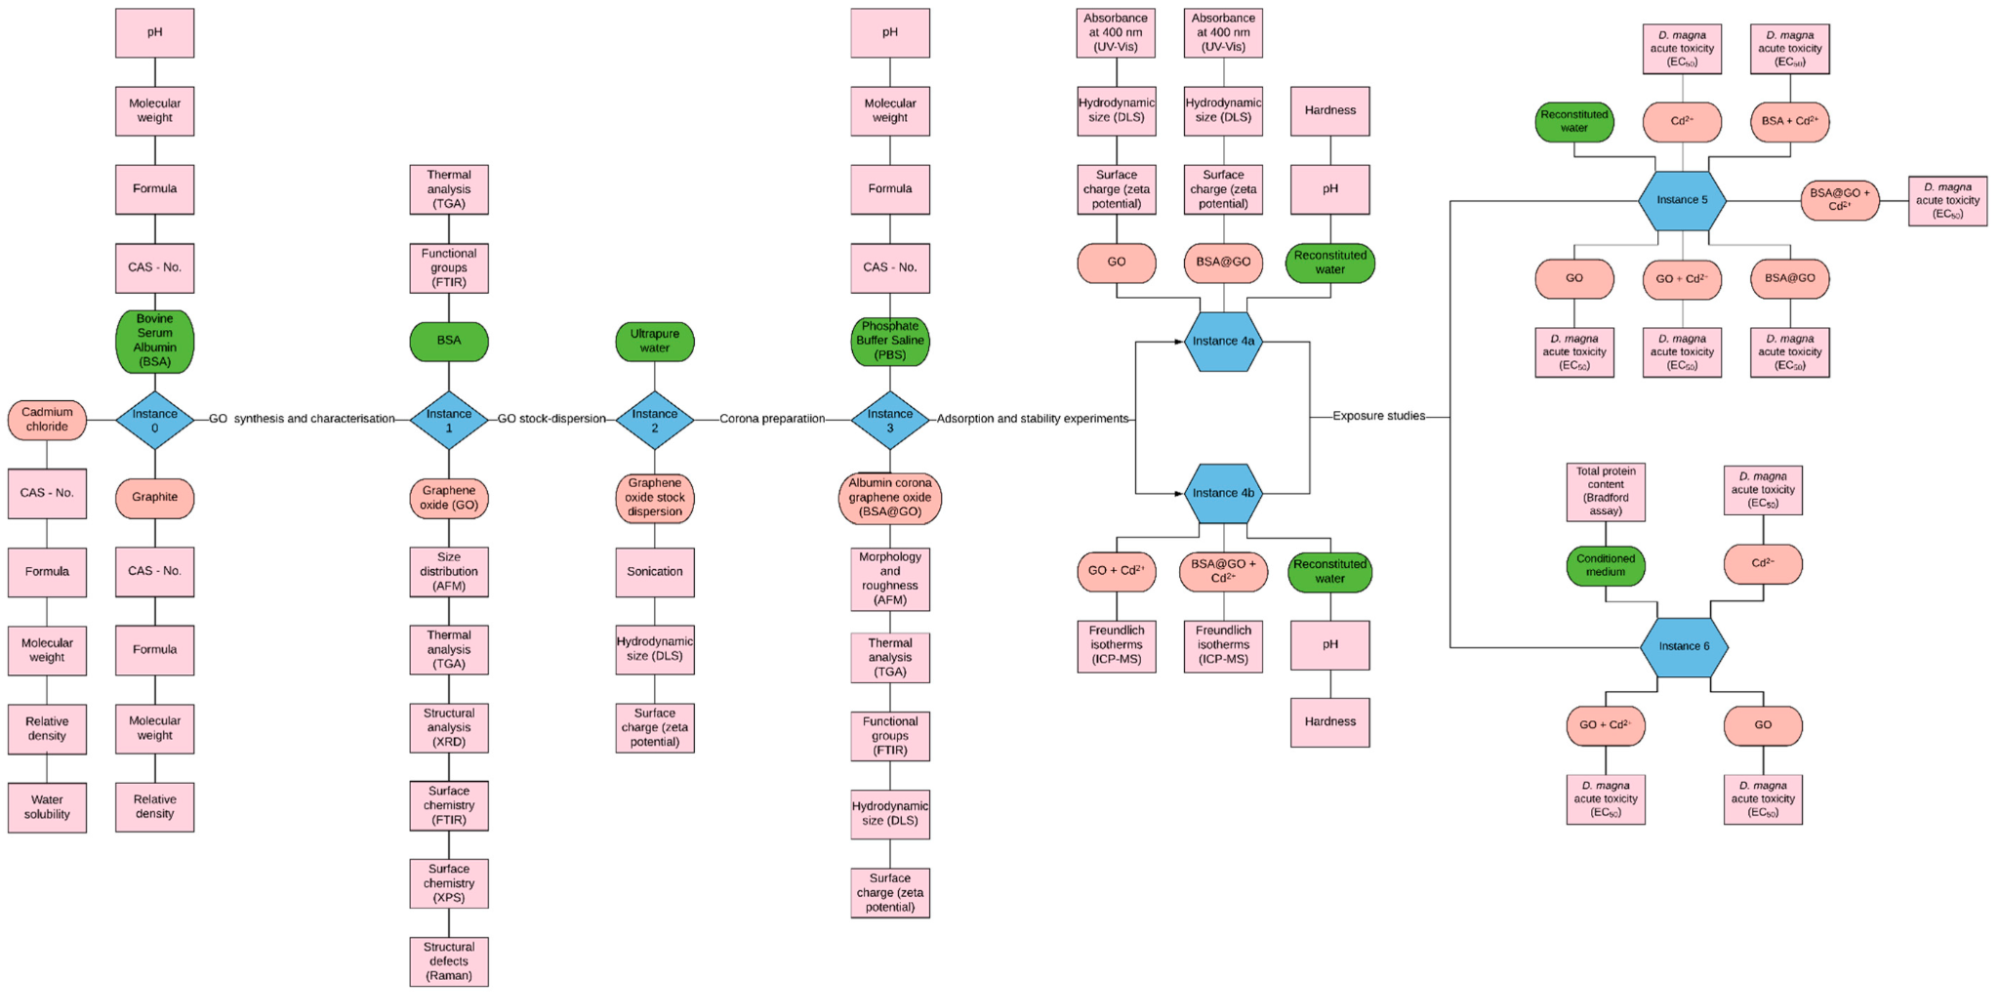 Figure 1. Instance map of the experimental workflow from Martinez et al. (Martinez et al., 2020).
For toxicology testing in particular, a much-overlooked step is the need to establish baseline assay performance data for each specific laboratory. For example, how is a specific cellular assay performing based on the negative and positive controls selected and how is this changing over time and between operators? For ecotoxicity labs, this can include determination of the typical growth and reproduction curves and how these vary, such that any changes in the baseline performance can be noted and considered in interpretation of toxicity data. Having a baseline set of data for a representative nanomaterial for the specific end-point of interest would also be a huge step forward in terms of enhancing the interoperability of datasets from different laboratories. Including this in the extended study design documentation, and the study visualisation, and development of a reporting template, will provide a means to increase awareness and consistency and interoperability across datasets. Having such information in a well-defined and structured format would also improve the harmonisation and interoperability with other areas like materials modelling and characterisation, which started to report information on the underlying physical effects and theories in the form of structured MODA and CHADA templates (Romanos et al., 2019)(What makes a material function, 2017), respectively.
Providing the study design as such visual experimental maps allows, besides being able to cover the information on this design as actionable metadata, that data collection can also be already organised at this stage and can be integrated directly into the data generation process. While the complete map will always be available to put every piece of information into relation of the overall instances / assays / data points, users can zoom into specific areas and then organise the information collection e.g., specifically for one of the characterisation endpoints including structured reporting of the protocols or even detailed handling of the chemicals required for the experiment. This has the advantage that the different parts can be handled more or less independently in a modular and harmonised fashion, allowing the data input at the time it is generated and not only at the end when the study has been completed. The complexity of the data capturing templates will be extremely reduced since individual transformations from one instance to the next as well as each characterisation and toxicology endpoint can use their own specifically designed template and all these will then be collected and packaged into the final dataset.
This documentation of individual parts of an experimental study can utilize the established workflow within the ELN and the NIKC/NanoFASE data capture templates, allowing us to build on the learnings from the first round of demonstration case studies and generalise them via the new demonstration case. Thus, this new demonstration case continues with the very strong focus on the metadata aspects of existing experimental workflows. It will demonstrate further the vital role played by the data shepherds in organising the capture of vital information from and about experimental (and computational) studies. It will also identify ways that NanoCommons can further facilitate the implementation of data management and data shepherding processes into the early stages of the data life cycle. Strong emphasis will be put on the metadata about the study design needed to make the data re-usable by others and on capturing the metadata aspects and implementing tools to evaluate experimental data and metadata completeness both of published studies and of experimental designs prior to the experiments being implemented (essential to moving data management to earlier in the data life cycle). Dividing the data collection and distributing it to different roles (e.g., data creator, data steward, etc.) in the data life cycle will allow reuse of existing or emerging standards like the MODA (for documenting models) and CHADA (for documenting characterisation assays and methods) templates (to cover detailed and reusable descriptions of test methods and their theoretical basis. Combining these templates with a fine-grained structure of the reported information, that is harmonised and integrated with existing ontological terms and, thus, with existing nanosafety database schema, will represent a huge step forward for the community. Such structured reporting, combined with support tools to fill in the information in a consistent and harmonised manner, should finally support ful ontological annotation (with on-the fly-terms if existing terms are not found) and linking to the NanoCommons Knowledge Base (KB), thus facilitating the R in FAIR by enhancing the re-usability of the datasets.
Aims
The objectives of this case are to systematise how information on the design stage (including assumptions / hypotheses, baseline assay performance data, user training in the assays, and the full experimental design as an instance map) can be encoded into the metadata to be provided as part of the resulting datasets as a quality-ensuring measure. This will be achieved through the development of visual representations of the representative study designs, including, e.g., some of the OECD test guidelines for regulatory testing, providing the applied quality control criteria, the replicate information, the pre-experimental details (media preparation and aeration for example), and other key aspects that are part of the assumed or implicit knowledge but not often documented. This will be supplemented with best practice on documentation of assay repeatability in individual labs, as part of the overall metadata required to ensure high-quality and re-usable data that is fit for purpose for integration in modelling and regulatory risk-assessment.
The demonstration case will then also explore how these visual maps and information on the study design associated with it can be used to organise the data collection and curation process directly from day 1 of study execution. Data curation templates and data input tools will be optimised to, first, support individual parts of the overall map like documenting the procedure to transform one nanomaterial instance to the next or specific characterisation or toxicology assays and, second, to then collect all these different parts to generate the final dataset.
Tasks
This case will develop approaches and tools to create detailed visual experimental maps and apply them to a range of key workflows in nanosafety to describe all the required measurements and characterisation aspects, including those needed for quality control and confirmation of assay validity (e.g., for daphnia acute toxicity tests this includes information on the medium pH and DO at the end of the exposure, as well as confirmation that <10% of the control population died during the experiment, in addition to details of the NMs characteristics before, during and after the experiment). The resulting maps will then be a basis for assessment of the quality and completeness of published and planned studies, in terms of the required data and metadata for optimal use and re-use of the data.
For use in regulatory testing, labs should also have documentation on the performance of the specific assay over time in the specific laboratory, against which to compare a specific set of results from that assay. This is not commonly reported in nanosafety literature, which is likely to be a result of the highly interdisciplinary nature of the field where researchers performing toxicity evaluations may not have had formal toxicology / regulatory training and thus may not be aware of these “hidden” best practice activities regarding assessment of assay performance in the specific laboratory. Thus, a white paper and a reporting standard (along the lines of the MODA/CHADA) for reporting/benchmarking of biological assay performance in individual laboratories will be developed, including guidance on what this might look like for different assays (e.g., for cytotoxicity testing, for genotoxicity testing, and for acute and chronic Daphnia magna ecotoxicological testing, as exemplars). Reporting of this data as part of the supplementary file of nanotoxicity / nanosafety publications will also increase the quality of datasets and enhance their re-usability in development of nanoinformatics models. For example, for daphnia, monitoring of their “normal” behaviour in our laboratory includes assessment of the time to first broods and average number of offspring per brood in the specific testing medium. For cytotoxicity experiments using immortalised cells, this would include details of the passage number and how the doubling time and viability vary with passage number.
Expected outcome
A best practice guideline, reporting template / metadata standard linked to the graphical experimental design (instance maps) and corresponding reporting tools will be developed to support users in implementing this best practice in their own labs, and in documenting it as part of their publications to support data reusability and assessment of fitness for purpose for modelling, regulatory decision making and more. This will consider parallel activities in other areas like material modelling and characterisation and will include implementation of CHADA for reporting of characterisation assays and development of a similar structure for reporting of the biological assay performance in the specific lab, to allow benchmarking and interoperability of data from different labs.Included in this guidance will be an indication of effort/time required to complete the tasks demonstrated, equipment / software that facilitate these tasks, training that is needed (including the specific roles required including the data shepherd role), rate limiting steps within the experimental design, and areas of the approach that would benefit from further development.
The utility of the graphical best-practice experimental design summaries as a means for assessing the quality, completeness and fitness for purpose for different re-use cases will also be evaluated. In summary, this case study documents what needs to be measured / captured for a fully complete experiment with optimal data re-usability.
References
- Martinez et al., 2020: Martinez, D. S. T.; Da Silva, G. H.; de Medeiros, A. M. Z.; Khan, L. U.; Papadiamantis, A. G.; Lynch, I. Effect of the Albumin Corona on the Toxicity of Combined Graphene Oxide and Cadmium to Daphnia Magna and Integration of the Datasets into the NanoCommons Knowledge Base. Nanomaterials 2020, 10 (10), 1936. https://doi.org/10.3390/nano10101936.
- Romanos et al., 2019: Romanos, N.; Kalogerini, M.; Koumoulos, E. P.; Morozinis, A. K.; Sebastiani, M.; Charitidis, C. Innovative Data Management in Advanced Characterization: Implications for Materials Design. Materials Today Communications 2019, 20, 100541. https://doi.org/10.1016/j.mtcomm.2019.100541.
- What makes a material function, 2017: Directorate-General for Research and Innovation (European Commission); de Baas, A. F. What Makes a Material Function?: Let Me Compute the Ways : Modelling in H2020 LEIT NMBP Programme Materials and Nanotechnology Projects; Publications Office of the European Union: LU, 2017. https://data.europa.eu/doi/10.2777/404734.