FAIRness, completeness and data quality scores
Even if quality evaluation of datasets is a highly active area of research, we will cover current approaches and try to stay up-to-date with the information.
Table of contents
FAIRness scores
FAIR assessment tools
The use of tools assessing the FAIRness of data helps the future improvement of data FAIRness and therefore their re-use.
FAIR assessment tools: evaluating use and performance
FAIR maturity indicators
To remedy the proliferation of FAIRness measurements based on different interpretations of the principles, the RDA Working Group “FAIR data maturity model” established in January 2019 developed a common set of core assessment criteria for FAIRness, as an RDA Recommendation. In the course of 2019 and the first half of 2020, the WG established a set of indicators and maturity levels for those indicators.
FAIR Data Maturity Model Specification and Guidelines
Based on this, a reproducible computational workflow to assess data FAIRness in the life sciences was proposed and applied to different nanosafety databases.
A Semi-Automated Workflow for FAIR Maturity Indicators in the Life Sciences
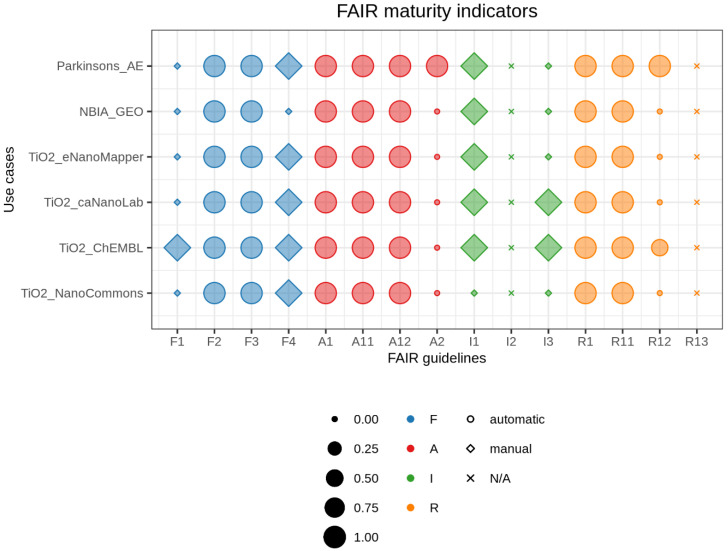 FAIR balloon plot. Comparative summary of FAIR maturity indicators for the six databases evaluated in this work. Size corresponds to the numerical value of mutual indicators, colors represent FAIR categories, and shapes illustrate the way we retrieved information (N/A = not available). The graph can be fully reproduced from our Jupyter Notebook on GitHub. (Ammar et al., 2020)
FAIR Badge System
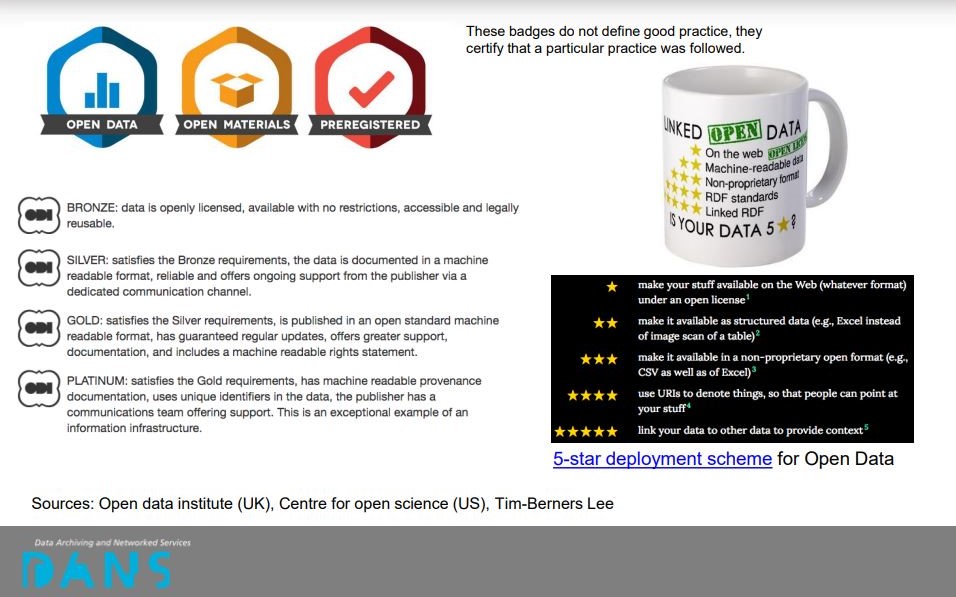
This system was proposed as a proxy for data quality assessment, and aims to operationalise the original FAIR principles to ensure no interactions among the four dimensions in order to ease scoring. The system then considers Reusability as the resultant of the other three, i.e. the average FAIRness score is then (F+A+I)/3=R.
GO FAIR Metrics
A team of FAIR principles authors and drivers have published a core set of semi-quantitative metrics for the evaluation of FAIRness.
GO FAIR Metrics for the evaluation of FAIRness
The 5-star deployment scheme
A very early evaluation of “how Findable data is” was proposed as part of a post on linked data by Tim Berners-Lee was published on the W3C website.
| ★ | Available on the web (whatever format) but with an open licence, to be Open Data |
| ★★ | Available as machine-readable structured data (e.g. excel instead of image scan of a table) |
| ★★★ | As (2) plus non-proprietary format (e.g. CSV instead of Microsoft Excel) |
| ★★★★ | All the above, plus: Use open standards from W3C (RDF and SPARQL) to identify things, so that people can point at your stuff |
| ★★★★★ | All the above, plus: Link your data to other people’s data to provide context |
Data completeness scores
NanoSolveIT / NanoCommons KB
The “data completeness” check developed as part of the NanoSolveIT project is based on a set of previously published use cases, e.g., ECHA grouping/read-across requirements, REACH nanoform definition, QSAR Tox prediction or NInChI generation, which each define a set of information about a NM as required to execute the corresponding use case. The implemented “data completeness” check performs a search across all available information associated with a specific NM to discover how much of the required information for each use case is available. The information is visualised and provided numerically. As this method is of generic applicability and of public interest for all NMs, the score became a new feature of the NanoCommons KB: 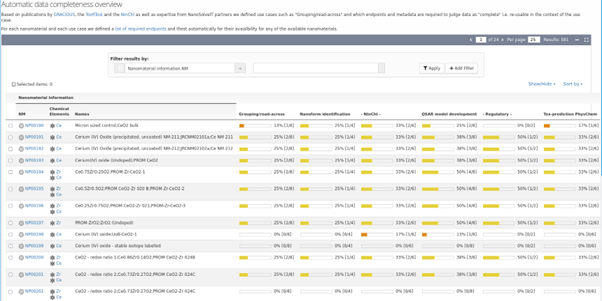
Data quality scores
Klimisch score
Klimisch et al. (Klimisch et al., 1997) developed a scoring system to assess the reliability of data from toxicological and ecotoxicological studies [12]. This rating system has been extended to physico-chemical studies and is now accepted by many regulatory authorities and organisations. ECHA’s IUCLID 6 software includes rationale for assigning Klimisch scores for toxicology testing, based on utilisation of standard assays. To automate the process of assigning Klimisch scores, ToxRTool (Toxicological data Reliability Assessment Tool) (Schneider et al., 2009), an Excel-based tool, was developed by ECVAM to provide comprehensive criteria and guidance for evaluations of the inherent quality of toxicological data.
GuideNano score
The Klimisch score was extensively considered and adapted for application to nano studies within the GUIDEnano project.
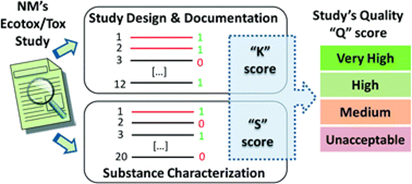 Figure. The scoring system related to test design and reporting considerations developed following the principles of the Klimisch score (K score). In addition, a scoring system based on the physicochemical properties that have been characterised and reported for the NM, including properties characterised in the exposure medium was developed (S score). These two scores (K and S) are combined to obtain an overall quality score (Q score) that can be used to select studies, to weight different studies, and/or to introduce uncertainty factors in the risk assessment process (Fernandez-Cruz et al., 2018).
References
- Ammar et al., 2020: Ammar, A.; Bonaretti, S.; Winckers, L.; Quik, J.; Bakker, M.; Maier, D.; Lynch, I.; van Rijn, J.; Willighagen, E. A Semi-Automated Workflow for FAIR Maturity Indicators in the Life Sciences. Nanomaterials 2020, 10 (10), 2068. https://doi.org/10.3390/nano10102068.
- Fernandez-Cruz et al., 2018: Fernández-Cruz, M. L.; Hernández-Moreno, D.; Catalán, J.; Cross, R. K.; Stockmann-Juvala, H.; Cabellos, J.; Lopes, V. R.; Matzke, M.; Ferraz, N.; Izquierdo, J. J.; Navas, J. M.; Park, M.; Svendsen, C.; Janer, G. Quality Evaluation of Human and Environmental Toxicity Studies Performed with Nanomaterials – the GUIDEnano Approach. Environ. Sci.: Nano 2018, 5 (2), 381–397. https://doi.org/10.1039/C7EN00716G.
- Klimisch et al., 1997: Klimisch, H.-J.; Andreae, M.; Tillmann, U. A Systematic Approach for Evaluating the Quality of Experimental Toxicological and Ecotoxicological Data. Regulatory Toxicology and Pharmacology 1997, 25 (1), 1–5. https://doi.org/10.1006/rtph.1996.1076.
- Schneider et al., 2009: Schneider, K.; Schwarz, M.; Burkholder, I.; Kopp-Schneider, A.; Edler, L.; Kinsner-Ovaskainen, A.; Hartung, T.; Hoffmann, S. “ToxRTool”, a New Tool to Assess the Reliability of Toxicological Data. Toxicology Letters 2009, 189 (2), 138–144. https://doi.org/10.1016/j.toxlet.2009.05.013.